Lecture4-Note
Logic and Probability For Statistics
Descriptive Statistics
-
What is a Mean (M) ?
- Measurement of central tendency
- Mathematical midpoint (average) of a data set
-
Standard Deviation (SD)
-
Measurement of variability
-
How variable is the data
-
How close to the mean is a given value
   Target of descriptive statistics:
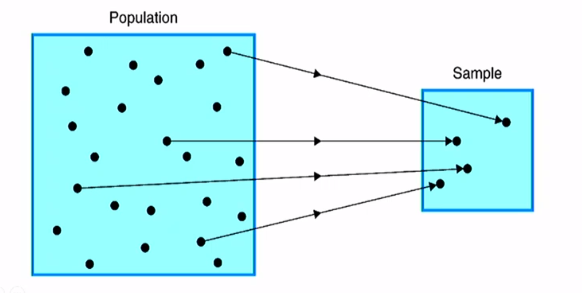
   Descriptive statistics can be run on the entire target and take a sample is the usually method.
   Use the sample M and SD of an enough sample size to represent the entire target's statistics.
-
-
NHST (Null hypothesis significance testing)
A systematic procedure for deciding whether the outcome of a study (results from a sample) support a particular theory (which is thought to apply to a population)

If you want to draw a conclusion about a population, your sample better be from that population. -
Probability
- Definition: The expected relative frequency of a particular outcome
- Relative frequency - # of times something happens relative to # of times it could have, like 4/10
- Expected relative frequency (probability)
- Probability = = = expected relative frequency
- proportion: 0 - 1
- Definition: The expected relative frequency of a particular outcome
-
NHST uses deductive reasoning
-
Deductive Reasoning: From general to specific - Theory to hypotheses
-
Inductive Reasoning: From specific to general - Observations to theories
-
P<0.05
We have to find one false case to disprove
-
-
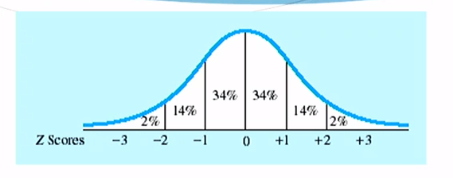
Normal Curve

- Unimodal, symmetrical, bell-shaped curve
- Mathematical (or theoretical) distribution
- 34-14-2
- p<0.05 (below -1.96 & above 1.96)
-
Z-Scores (标准化)
A Z-score is the number of standard deviations the score is above or below the mean.- Standardization: Process of converting raw scores into Z-scores
- Formula:
-
Sampling Distribution
One individual -> distribution of individual scores Mean -> distribution of means- Standard Error (SE)
Measurement of variability of samples (Mean of means)
Z-score computing formula:
= mean of the distribution of means
= standard deviation of the distribution of means aka “standard error (SE)” - Standard Error (SE)
Inferential Statistics
-
Practical Significance
- Statistical significance does not guarantee the result is meaningful
- Strong significance (p<0.001) means a reliable effect, not necessarily a strong effect
-
Effect Size
An effect size is a measure of the strength of the relationship between two variables. Most commonly reported effect size is Cohen’sSmall effect Medium effect Large effect 0.2 0.5 >0.8 -
Types of statistical tests
Continuous predictor (e.g, how much) Categorical predictor (e.g, exp vs control) Continuous outcome(e.g, how much) Correlation or regression T-test or ANOVA Categorical outcome (e.g, yes/no) logistical regression chi-square test or loglinear -
t-tests
Simple test for comparing groups
independent samples t-test vs. paired samples t-test
e.g, t(18) = 19.06, p = 0.0001 “18” is degrees of freedom, “19.05” is t-value, “0.0001” is significance
- Independent Samples t-test
- Compares two independent groups
- One example:

- Paired-Samples t-test
- Compares one (the same) group that has been tested twice
- Before and after; under two different conditions
- One example:

- Independent Samples t-test
-
Analysis of Variance (ANOVA)
Used when experiment has a more complex design. (variables with more than two levels, multiple predictor variables)- One-way ANOVA
- Used when the predictor variable has more than two levels
- One example:

- Repeated measures ANOVA
- Used when group has been tested more than twice
- One example:

- Factorial ANOVA
- Used for multiple predictor variables (one of more can be repeated measures)
- Each variable has a main effect
- Variables can have interactions effects
- One-way ANOVA
-
Chi-Square
- Used to analyze categorical (count or proportion) data
-
Correlation coefficient
- Used to represent the relationship between two continuous variables.
- Used to represent the relationship between two continuous variables.


