Lecture6-Note
Correlation
What is Correlation
- Two variables are correlated (associated) when their values are not independent
- Probabilistically speaking
- Examples:
- When people by chips they are very likely to buy beer
- When people have yellow fingers, they are very likely to smoke
Variables that are predictive
- Some variables are predictive because they are correlated with other target variables
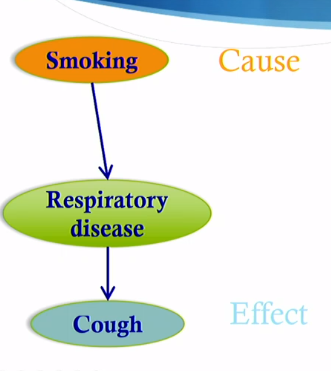
- Smoking and coughing are predictive variables for respiratory disease
Cause and Effect
- A variable v1 is a cause for variable v2 if changing v1 changes v2
- A variable v3 is an effect of variable v2 if changing v3 does not change v2
Correlation and Causation
- Correlation
- Knowledge of v1 provides information for v2
- Eg: yellow fingers, cough, smoking, lung cancer
- Can use any data collected and do statistical analysis
- Knowledge of v1 provides information for v2
- Causation
- Run an Experiment (or randomized controlled trial) - The best way to show causality
- From sample (eg 1000), randomly assign:
- 500 (control condition)
- Eg smokers
- 500 (treatment/experimental condition)
- Eg stop smoking
- 500 (control condition)
- If there is a difference, then evidence for causality
- From sample (eg 1000), randomly assign:
- Run an Experiment (or randomized controlled trial) - The best way to show causality
Latent Variables
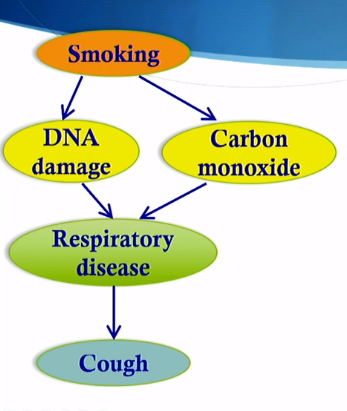
- Latent variables are variables that cannot be directly observed, only inferred through a model
- Eg DNA damage
- Eg Carbon monoxide inhalation
- Latent variables can be hard to identify, even harder to learn automatically from data
Graphical Model
- Graphical Model, or graph that captures dependencies among variables, is on alternative approach
What is Graphical Model

- Graph that captures dependencies among variables
- Nodes are variables
- Links indicate dependencies
- Probabilities that represent how the dependencies work
Two Graphical Models
- Graphic links have a direction
- Cycles not allowed
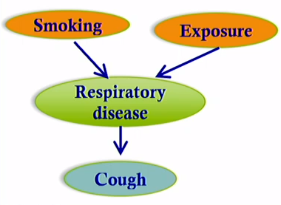
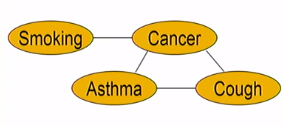
- Graph links do not have direction
- Cycles are allowed
Bayesian Networks
- A Bayesian network is a graph
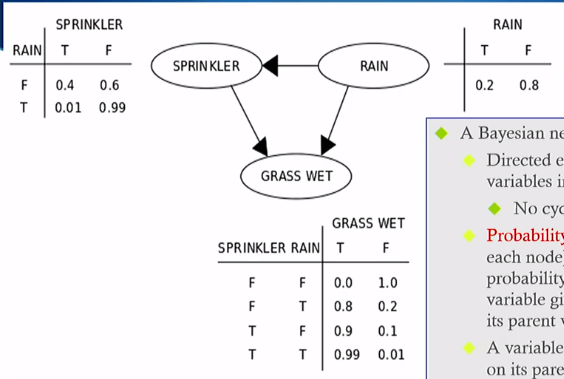
- Directed edges show how variables influence others (No cycles allowed)
- Probability tables (one for each node) show the probability of the value of a variable given the values of its parent variables
- A variable is only dependent on its parent variables, not on its earlier ancestors
Causal Models
- A causal model is a Bayesian network where all the relationships among variables are causal
- Causal models represent how independent variables have an effect on dependent variables
- Causal reasoning uses the probabilities in the causal model to make inferences about the value of variables given the values of others
- Eg: Given that the grass is wet, what is the probability that it rained?
Bayesian Inference
- Bayesian inference is used to reason over a Bayesian network to determine the probabilities of some variables given some observed variables
- Eg: Given that the grass is wet, what is the probability that it has been raining?
Markov Networks
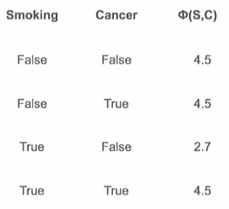
- A Markov network is an undirected graphical model that includes a for each clique of interconnected nodes
Learning Graphical Models
- Parameter Learning
- Learning the parameters (probabilities) of the model
- Structure Learning
- Learning the structure of the model (like the structure of the graph)
Analyzing Network Data
Network Structure
- Graphs of nodes connected by links
- Nodes: entities of interest(ie, a person, a protein, a Web page…)
- Links: relation between two nodes
Dynamic Networks – Representing Network Behavior
- Behaviors of the entities over time
- Network structure may also change over time
- Weak vs strong links change
- Changes almost always have trickle effects on the rest of the network
Sources of Networked Data
- Messages across people
- Social network sites
- Social media
- Constructing networks from other data
Types of Networks
- Homogeneous networks
- Heterogeneous networks
- Bipartite networks
- Social networks
Homogeneous vs Heterogeneous Networks
- Homogeneous networks: all nodes have the same type
- Heterogeneous networks: node have different types
Bipartite networks
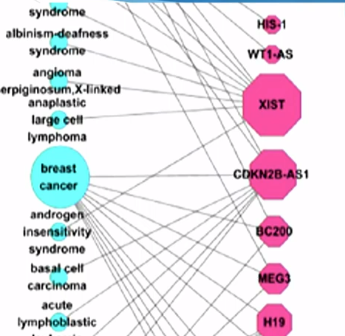
- Bipartite networks: nodes have two types, links are between the two types of nodes
Social Networks
- People as nodes, links represent interactions
- Major issue: networks in social sites are often note publicly accessible
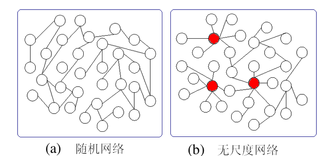
Random Network & Scale-Free Network
Random Network
- Every node’s connection tend to be similar
- random formation
Scale-Free Network
- Each node has Few (and different) connections
- A few nodes may have many connections
- Example: The Internet and the Web are scale-free networks; sexual partnership between human
Cliques and Connected Components
- A clique is a subgraph where all the nodes are connected to all the other nodes in the clique (All paths)
- A connected component is a subgraph where for any two nodes in the subgraph there is a path that connects them (at least one)
Bridge
- A bridge is a link between two nodes that if removed would result in the nodes being in disconnected components of the graph
Centrality
- “Degree centrality” is assigned to the node with the most links
Analyzing Time Series Data
Why Time Series Data
- Forecasting: prediction of upcoming events
- Signal or anomaly detection: get rid of noise and find unexpected patterns that might signal an event
- Used in IoT systems to track system health and trends
- Used in research to study questions that unfold over time
Collecting Time Series Data
- Source of Time Series Data:
- Sensors: Environment, body, traffic…
- Economic: Government reports,…
- Commercial: Customers, products, usage,…
- Social: Activities, emails, tweets,…
- Some terms
- Sampling rate: how often data is collected over time
- Granularity: period to generate a single, aggregated data point
- Adaptive sampling: Changing the sampling rate when something interesting is detected
- Streaming data: When data is collected and stored continuously
Pre-Processing Time Series Data
- Data cleaning: correcting errors
- Imputation: hypothesizing missing values (eg, using average to be missing values)
- Rescaling: converting to another sampling rate or granularity
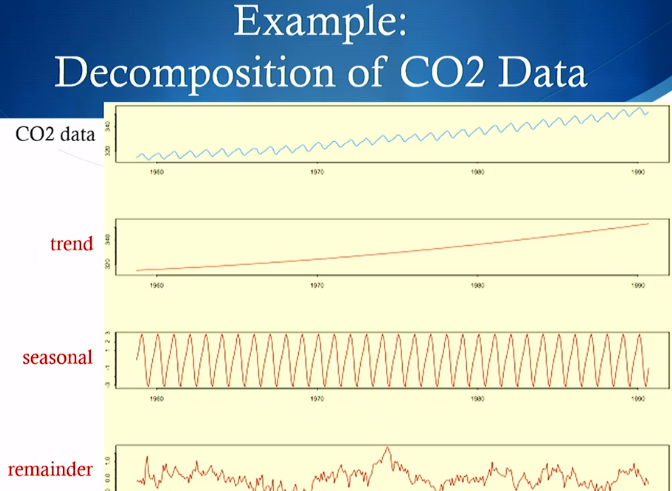
- Decomposition: separating major components
- 3 components:
- Trend: slowly changing over time
- Seasonal: periodicity
- Remainder: random noise, irregularities
- 3 components:
Example:
Analyzing Time Series Data
Variable Tracking
- Given a variable, account for its values over time
- Get the Tracking coefficient
- The variable may be unobservable, instead it must be derived from observed variables (aka tracking a “latent” variable)
Alert Systems
- Given a variable, track its values over time and generate an alert when it goes over a threshold
- The variable may not de directly observable, instead it could be derived from observed variables
Event Detection
- Given: an event pattern specified as a (set of) variable(s) and their value ranges over timeframes
- Find: a match of the event pattern against the time series
Detection of Trigger Events
- Given: an event pattern composed of a set of variables and their value ranges over timeframes
- Find: an event pattern that occurs earlier in the time series where there is correlation or causation with the given event pattern
Causality Detection
-
Given: a time series
-
Find: events that may be temporally related through a causal relation
-
Only one direction!
Granger Causality
- Time series X “Granger-causes” time series Y if past values of X can be used to predict future values of Y
- above and beyond the information contained in past values of Y
Example:
- above and beyond the information contained in past values of Y
- Time series X “Granger-causes” time series Y if past values of X can be used to predict future values of Y
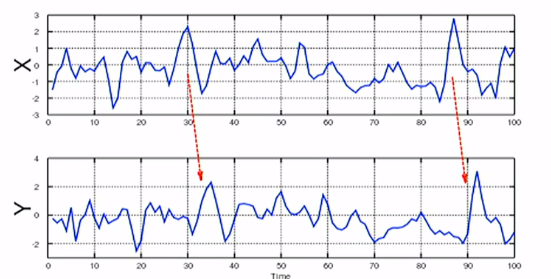
X is rain, and Y is umbrella sales. spike on rain are going have a causal effect on purchasing of umbrellas. If We did a Granger causality analysis, it would say that there’s evidence for Granger causality between rain and purchasing umbrellas.
Discovery of Unexpected Events
- Given a times series, track its variables and report any unusual values or patterns
- System must have some definition of “unusual”
Pattern Mining
- Given a time series, identify patterns that are:
- predictive of all or some of the variable values
- predictive of correlations among variables
- characteristic of the data (even those that are complex, non-periodic, irregular, chaotic)
All articles in this blog are licensed under CC BY-NC-SA 4.0 unless stating additionally.
Comment
